Non-parametric bootstrap of item-restscore fit using
iarm::item_restscore(). For each iteration, a sample of size samplesize
is drawn from data with replacement, the appropriate Rasch model is
refitted, and item-restscore results are classified as "overfit",
"underfit", or "no misfit" based on the BH-adjusted p-value (< .05) and
the sign of expected - observed. The function returns the percentage of
iterations in which each item is flagged.
Usage
RMitemRestscoreBoot(
  data,
  iterations = 200,
  samplesize = 600,
  parallel = TRUE,
  n_cores = NULL,
  cutoff = 5,
  verbose = FALSE,
  seed = NULL,
  output = "kable"
)
Arguments
- data
A data.frame or matrix of item responses. Items must be scored starting at 0 (non-negative integers).
- iterations
Integer. Number of bootstrap samples (default 200).
- samplesize
Integer. Size of each bootstrap sample (default 600). Must not exceed
nrow(data).- parallel
Logical. Use parallel processing via
miraiif available (defaultTRUE).- n_cores
Integer or
NULL. Number of parallel workers. WhenNULL,getOption("mc.cores")is checked first. If neither is set andparallel = TRUE, a warning is issued and execution falls back to sequential processing.- cutoff
Numeric. Items flagged in fewer than this percentage of iterations are excluded from the kable output (default 5). Has no effect when
output = "dataframe"oroutput = "raw".- verbose
Logical. Show a progress bar (default
FALSE).- seed
Integer or
NULL. Random seed for reproducibility.- output
Either
"kable"(default) for a formattedknitr::kable()table,"dataframe"for the per-item summary data.frame, or"raw"for the per-iteration long data.frame (useful for custom plotting).
Value
If
output = "kable": aknitr_kableobject listing items flagged in more thancutoff% of iterations, with columns Item, Item-restscore result, % of iterations, Conditional MSQ infit, and Relative item location, and a caption noting iteration count, bootstrap size, and number of complete cases.If
output = "dataframe": a data.frame with one row per item × classification combination (Item,item_restscore,n,percent,Infit_MSQ,Relative_location), including"no misfit"rows.If
output = "raw": a long data.frame with one row per item × successful iteration (iteration,Item,item_restscore,diff,diff_abs), wherediff = expected - observed.
Details
Useful with large samples, where the asymptotic test underlying
RMitemRestscore can flag items that are not practically
misfitting; bootstrapping gives a more nuanced view of the probability of
an item actually being misfit.
The full-sample model is fitted by CML via psychotools::pcmodel() (a
dichotomous item is a 2-category partial credit model), and item locations
(mean of the grand-mean-centred CML Andrich thresholds) and the mean WLE
person location are computed from it — consistent with
RMitemRestscore and the rest of the package. Each bootstrap
iteration draws a sample of size samplesize with replacement and refits via
psychotools::pcmodel(..., hessian = FALSE) for speed;
iarm::item_restscore() accepts the fitted model.
Conditional infit MSQ (computed once on the full sample via
iarm::out_infit()) and relative item locations are reported alongside the
bootstrap percentages for context. The item-restscore classification and the
infit statistic are conditional and engine-invariant; only the relative-item
location shifts slightly relative to the previous eRm implementation,
because it now uses the WLE person mean (finite at extreme scores) rather
than the eRm MLE mean.
Iterations that fail (e.g., due to convergence issues on a degenerate
bootstrap sample) are silently discarded; the caption / actual_iterations
reflects only successful runs.
Parallel processing is provided by the mirai package (optional). Install
it with install.packages("mirai") to enable parallelisation.
The iarm package must be installed (it is in Suggests, not Imports).
References
Kreiner, S. (2011). A Note on Item-Restscore Association in Rasch Models. Applied Psychological Measurement, 35(7), 557-561. doi:10.1177/0146621611410227
Examples
# \donttest{
if (requireNamespace("iarm", quietly = TRUE)) {
set.seed(42)
sim_data <- as.data.frame(
matrix(sample(0:1, 400 * 8, replace = TRUE), nrow = 400, ncol = 8)
)
colnames(sim_data) <- paste0("Item", 1:8)
# Few iterations for a fast example; use 100+ in real analyses
# Default kable output (only items flagged > cutoff%)
RMitemRestscoreBoot(sim_data, iterations = 50, samplesize = 300,
parallel = FALSE, seed = 1)
# Per-item summary data.frame (all classifications, including "no misfit")
summary_df <- RMitemRestscoreBoot(sim_data, iterations = 50, samplesize = 300,
parallel = FALSE, seed = 1,
output = "dataframe")
# Per-iteration long data for custom plotting
raw_df <- RMitemRestscoreBoot(sim_data, iterations = 50, samplesize = 300,
parallel = FALSE, seed = 1, output = "raw")
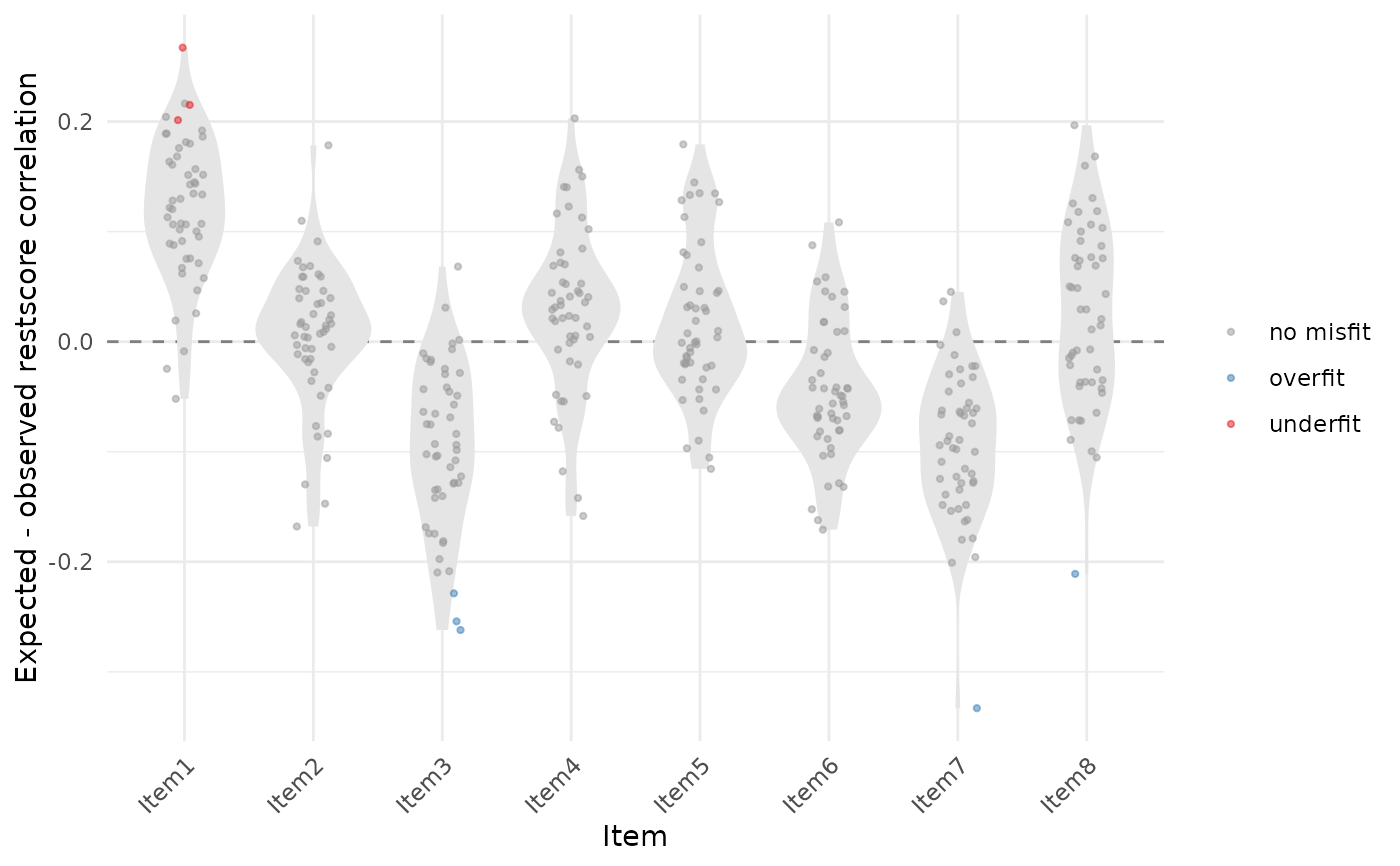
# Distribution of (expected - observed) across iterations, per item
if (requireNamespace("ggplot2", quietly = TRUE)) {
library(ggplot2)
ggplot(raw_df, aes(x = Item, y = diff)) +
geom_hline(yintercept = 0, linetype = "dashed", colour = "grey50") +
geom_violin(fill = "grey90", colour = NA) +
geom_jitter(aes(colour = item_restscore),
width = 0.15, alpha = 0.5, size = 0.8) +
scale_colour_manual(values = c("overfit" = "#377eb8",
"underfit" = "#e41a1c",
"no misfit" = "grey60")) +
labs(y = "Expected - observed restscore correlation",
colour = NULL) +
theme_minimal() +
theme(axis.text.x = element_text(angle = 45, hjust = 1))
}
}
#>
#>
#>
#>
#>
#>
#>
#>
#>
#>
#>
#>
#>
#>
#>
#>
#>
#>
#>
#>
#>
#>
#>
#>
#>
#>
#>
#>
#>
#>
#>
#>
#>
#>
#>
#>
#>
#>
#>
#>
#>
#>
#>
#>
#>
#>
#>
#>
#>
#>
#>
#>
#>
#>
#>
#>
#>
#>
#>
#>
#>
#>
#>
#>
#>
#>
#>
#>
#>
#>
#>
#>
#>
#>
#>
#>
#>
#>
#>
#>
#>
#>
#>
#>
#>
#>
#>
#>
#>
#>
#>
#>
#>
#>
#>
#>
#>
#>
#>
#>
#>
#>
#>
#>
#>
#>
#>
#>
#>
#>
#>
#>
#>
#>
#>
#>
#>
#>
#>
#>
#>
#>
#>
#>
#>
#>
#>
#>
#>
#>
#>
#>
#>
#>
#>
#>
#>
#>
#>
#>
#>
#>
#>
#>
#>
#>
#>
#>
#>
#>
 # }
# }