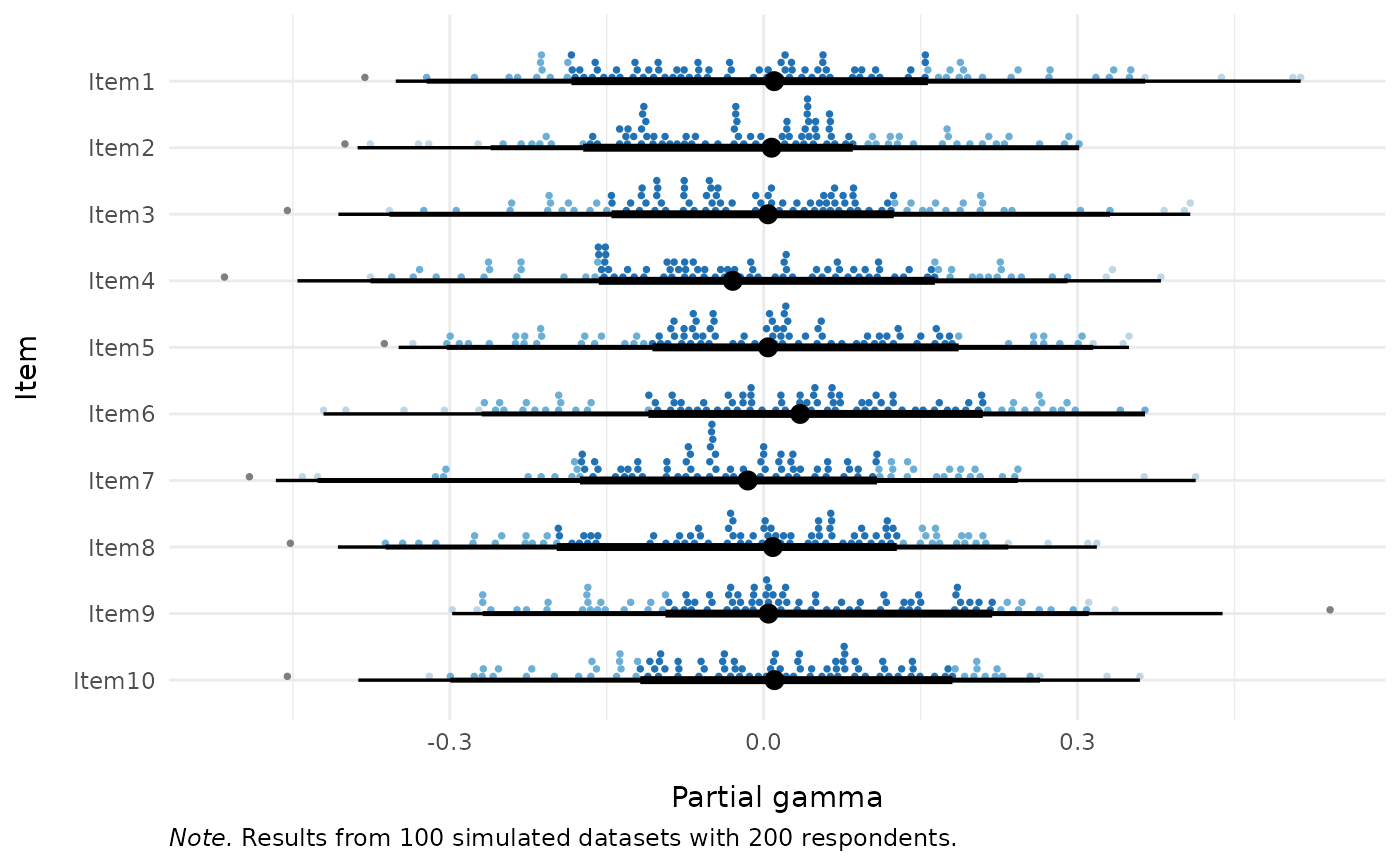
Visualises the distribution of simulation-based partial gamma DIF values
from RMdifGammaCutoff, optionally overlaying observed partial
gamma values computed from real data with the same routine the simulation
uses, which reproduces partgam_DIF exactly.
Arguments
- simfit
The return value of
RMdifGammaCutoff(a list with componentsresults,item_cutoffs,actual_iterations,sample_n, anditem_names).- data
Optional. A data.frame or matrix of item responses for computing and overlaying observed partial gamma values. Items must be scored starting at 0 (non-negative integers). When provided, the plot includes orange diamond markers for the observed partial gamma alongside the simulated distribution, plus segment summaries from the cutoff intervals.
- dif_var
Required when
datais supplied. A vector (factor, character, or integer) defining group membership for the DIF analysis. Must have the same length asnrow(data).
Details
Uses ggdist::stat_dotsinterval() (when data is not supplied) or
ggdist::stat_dots() (when data is supplied) with
point_interval = "median_hdci" and .width = c(0.66, 0.95, 0.99).
When data is not supplied, the function plots the simulated partial
gamma distributions as dot-interval plots using
ggdist::stat_dotsinterval() with median and Highest Density Continuous
Interval (HDCI) summaries.
When data is supplied (along with dif_var), the function:
Computes observed partial gamma values (identical to
iarm::partgam_DIF()).Overlays observed gamma values as orange diamond markers on the simulated distributions.
Shows per-item cutoff intervals (from
simfit$item_cutoffs) as black line segments, with thicker segments for the 66\ black dots for the median.
The ggplot2 and ggdist packages must be installed (they are in
Suggests, not Imports).
Examples
# \donttest{
if (requireNamespace("ggdist", quietly = TRUE) &&
requireNamespace("ggplot2", quietly = TRUE)) {
set.seed(42)
sim_data <- as.data.frame(
matrix(sample(0:1, 200 * 10, replace = TRUE), nrow = 200, ncol = 10)
)
colnames(sim_data) <- paste0("Item", 1:10)
dif_group <- factor(sample(c("A", "B"), 200, replace = TRUE))
# Run simulation
cutoff_res <- RMdifGammaCutoff(sim_data, dif_var = dif_group,
iterations = 100, parallel = FALSE,
seed = 42)
# Simulated distribution only
RMdifGammaPlot(cutoff_res)
# With observed partial gamma overlaid
RMdifGammaPlot(cutoff_res, data = sim_data, dif_var = dif_group)
}
 # }
# }