4  Mokken analysis

Author
Affiliation

Magnus Johansson

Published

2024-02-07

Code
# one package below requires that you use devtools to install them manually:
# first install devtools by
# install.packages('devtools')

library(RISEkbmRasch) # devtools::install_github("pgmj/RISEkbmRasch")
library(mokken)
library(readxl)
library(grateful)

### optional libraries
#library(TAM)
#library(skimr)

### some commands exist in multiple packages, here we define preferred ones that are frequently used
select <- dplyr::select
count <- dplyr::count
recode <- car::recode
rename <- dplyr::rename

source("RISE_theme.R")
Code
### import data
# df <- read_excel("data/MasterFile_CLEAN.xlsx") %>% 
#   rename(gender = WhatisyourgenderSelectedChoice,
#          age = Whatisyourage,
#          citizenship = WhatisyourcitizenshipSelectedChoice) %>% 
#   select(gender,age,citizenship,starts_with("mhc")) %>% 
#   select(-starts_with("mhc_"))
# 
# ### Load item information
# # make sure that variable names in df match with itemlabels$itemnr
# itemlabels <- read_excel("data/itemlabels_MHC_SF.xlsx") %>% 
#   mutate(item = str_squish(item))
# 
# #---- Create DIF variables----
#   
# # DIF variables into vectors, recoded as factors since DIF functions need this
# dif.gender <- as.factor(df$gender)
# dif.age <- df$age
# dif.citizenship <- as.factor(df$citizenship)
# # then remove them from dataframe, since we need a dataframe with only item data for the Rasch analyses
# df$gender <- NULL
# df$age <- NULL
# df$citizenship <- NULL
Code
### other, bigger dataset from [@echeverría2017]
### read file
df.all <- read_excel("data/data_sMHCSF_Echeverria2017.xlsx")
df <- df.all
### create dif variables
dif.sex <- factor(df$Sex)
df$Sex <- NULL

### Load item information
# make sure that variable names in df match with itemlabels$itemnr
itemlabels <- read_excel("data/itemlabels_MHC_SF.xlsx") %>% 
  mutate(item = str_squish(item))

names(df) <- itemlabels$itemnr

df <- df %>%
  mutate(across(everything(), ~ car::recode(.x,"'Never'=0;'1 or 2 times a month'=1;'About 1 time a week'=2;'About 2 or 3 times a week'=3;'Almost daily'=4;'Daily'=5", as.factor = FALSE)))

dfm <- as.matrix(df)

4.1 Mokken analysis 1

Recommended papers:

Assumptions of Mokken scale analysis

  • Assumption of unidimensionality
  • Assumption of local independence
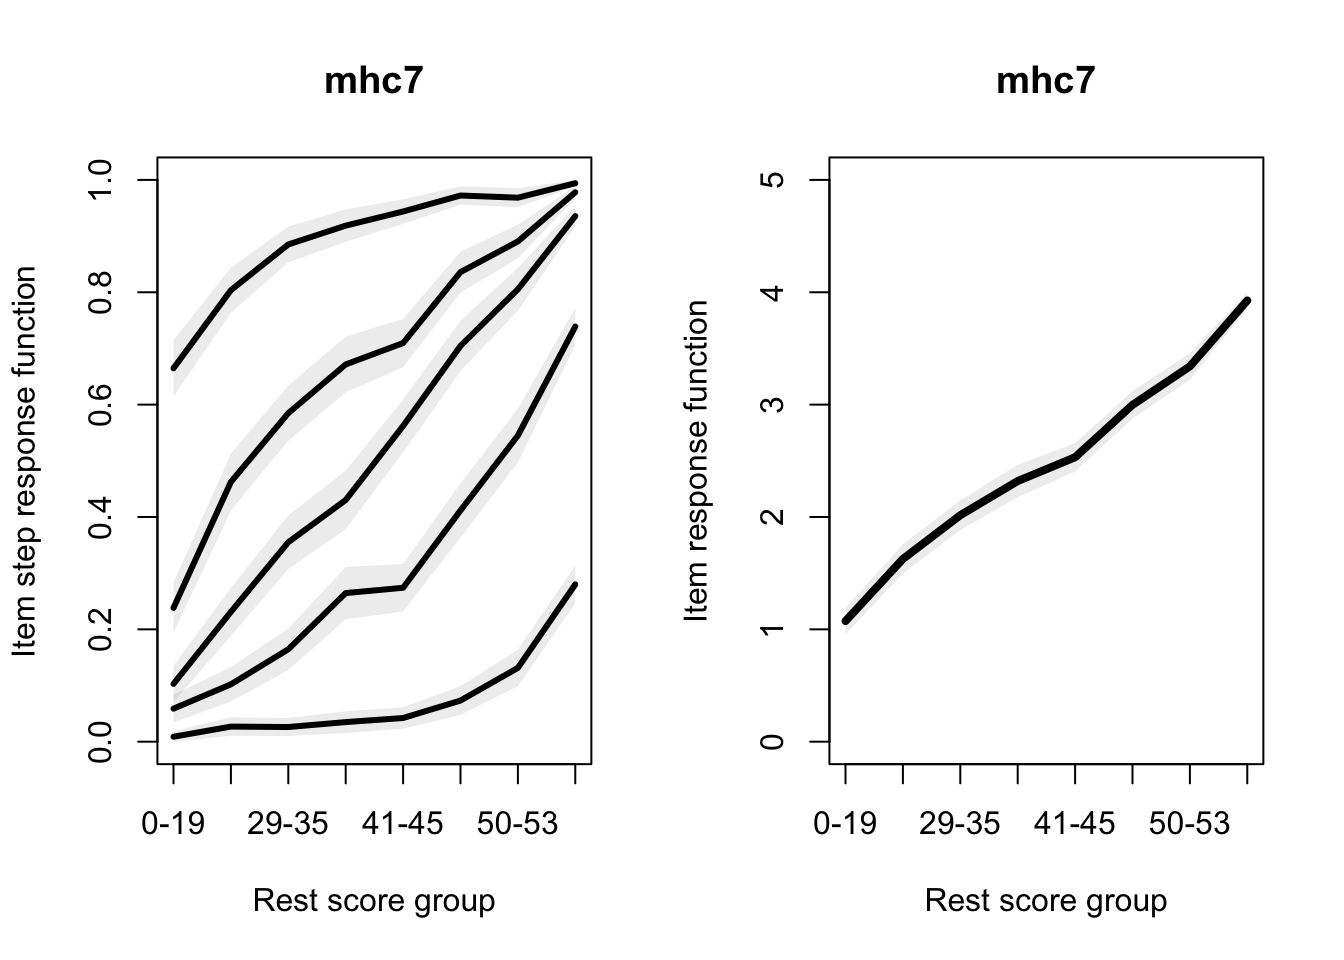
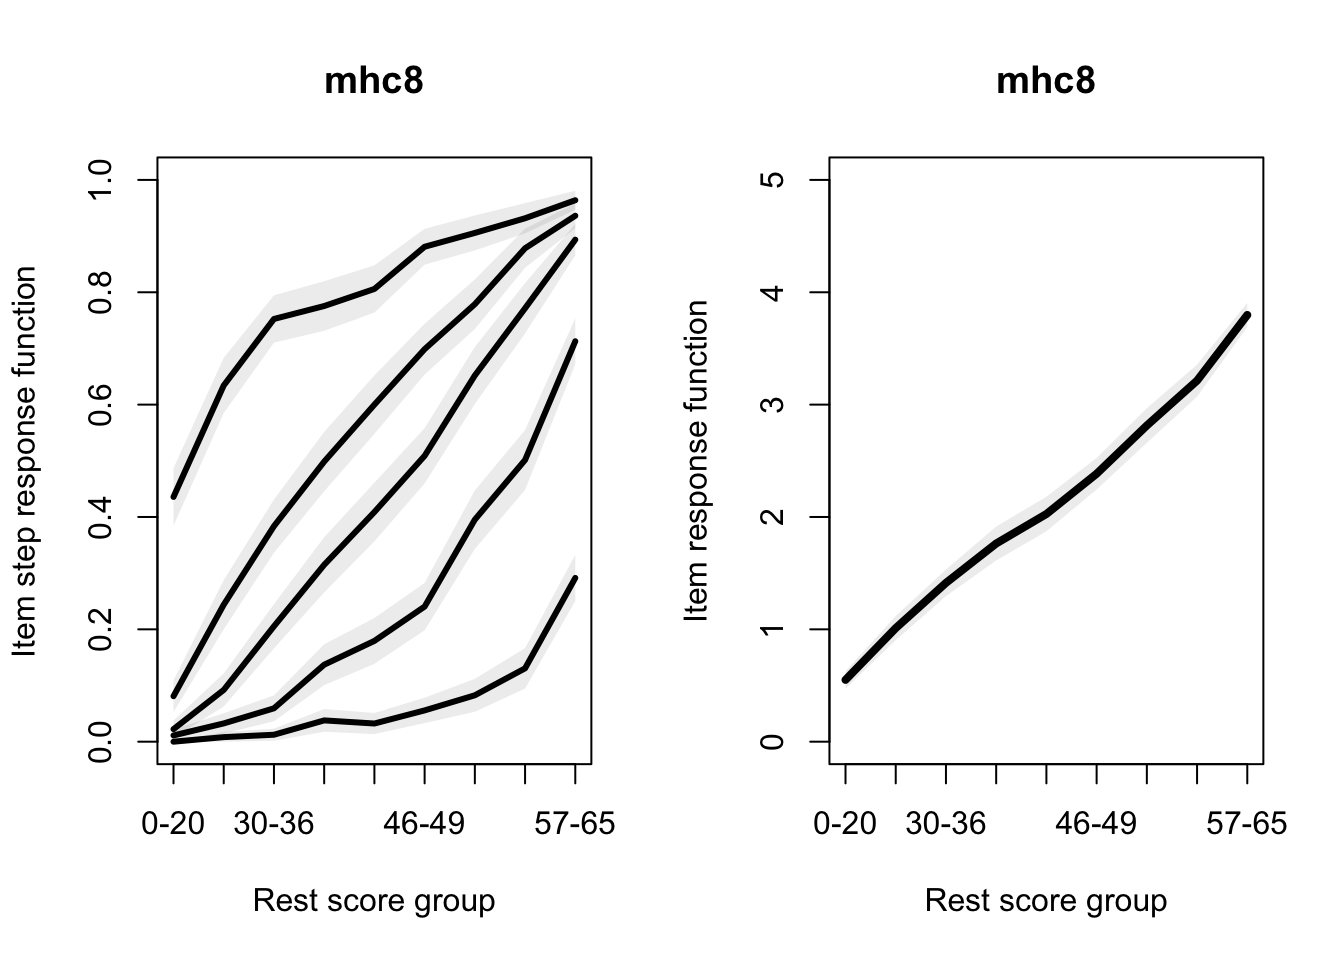
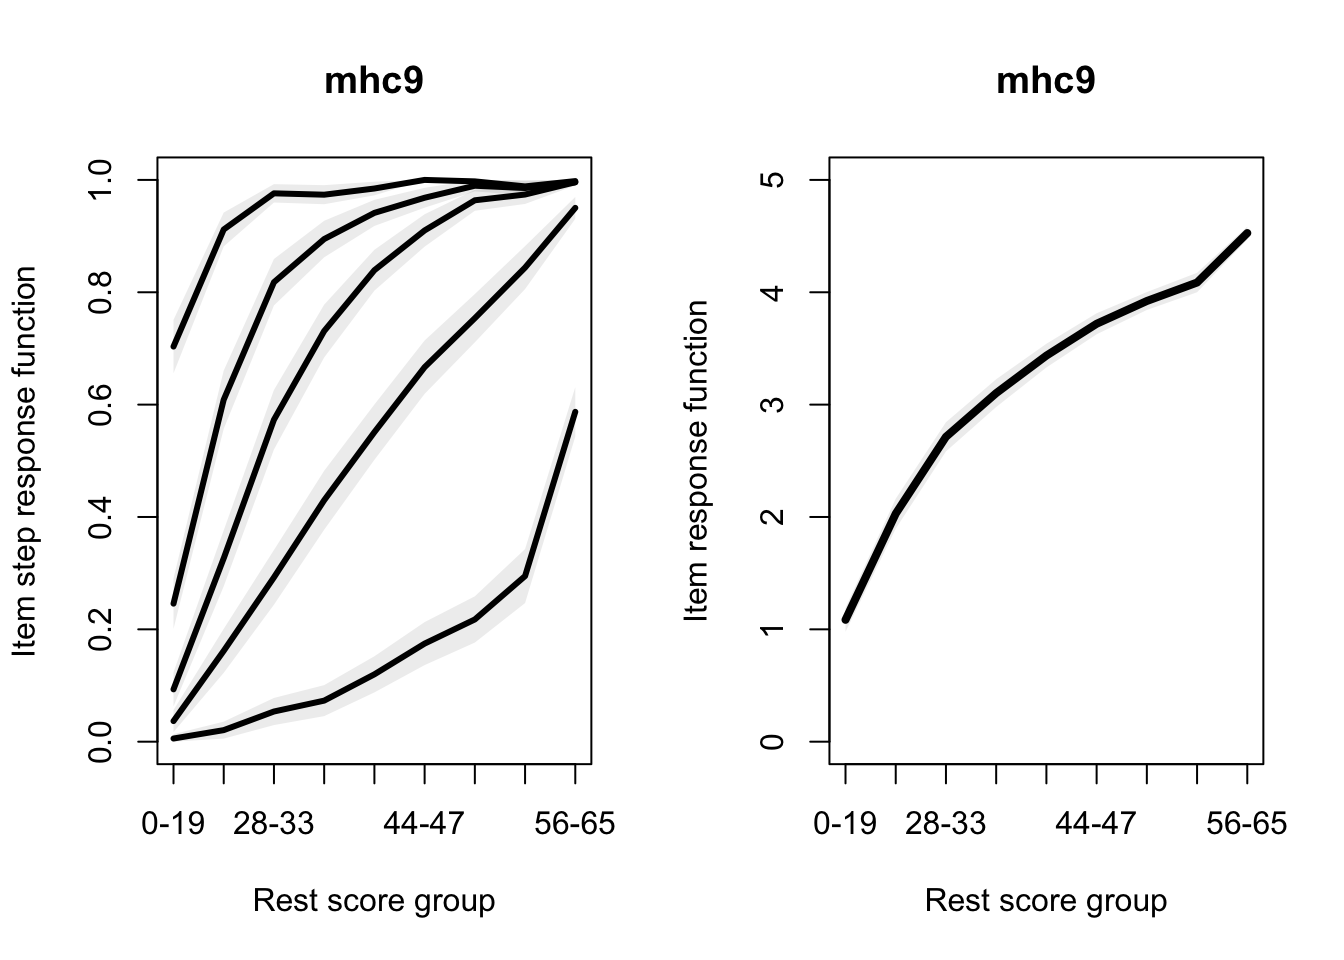
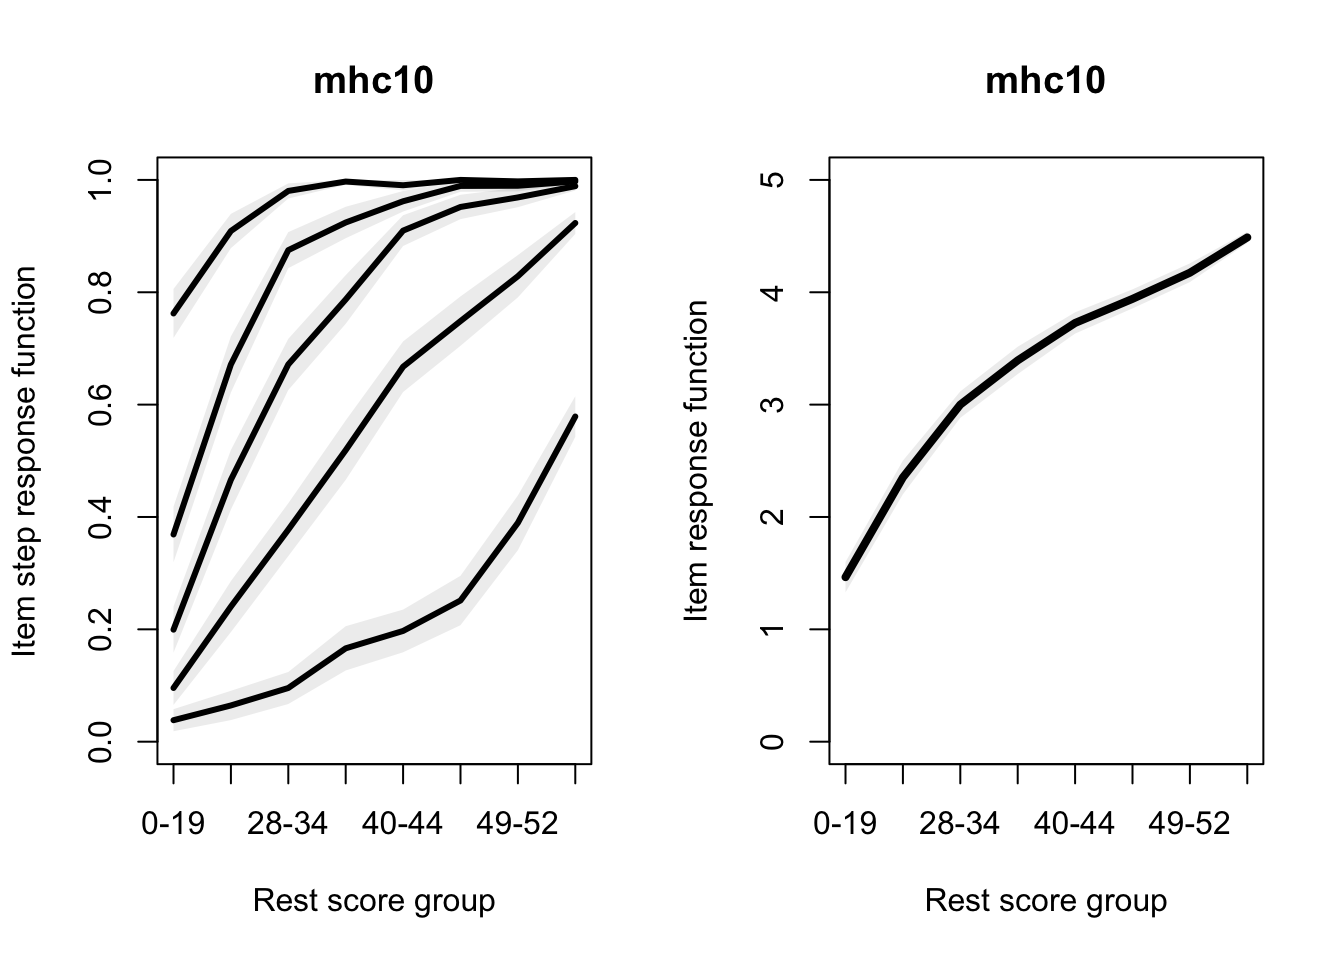
  • Assumption of monotonicity
  • Assumption of non-intersection
itemnr item
mhc1 Happy
mhc2 Interested in life
mhc3 Satisfied with your life
mhc4 That you had something important to contribute to society?
mhc5 That you belonged to a community?
mhc6 That our society is becoming a better place for people like you?
mhc7 That people are basically good?
mhc8 That the way our society works makes sense to you?
mhc9 That you liked most parts of your personality?
mhc10 Good at managing the responsibilities of your daily life?
mhc11 That you had warm and trusting relationships with others?
mhc12 That you had experiences that challenged you to grow and become a better person?
mhc13 Confident to think or express your own ideas and opinions?
mhc14 That your life has a sense of direction or meaning to it?

(Stochl, Jones, and Croudace 2012)

It is suggested that Loevinger’s scalability coefficients can be used for assessment of unidimensionality.

As a rule of thumb in practical interpret- ation of analyses, scales with H < 0.3 are not considered as unidimensional. Item sets with H coefficients higher than 0.3 and lower than 0.4 are typically considered to be indicative of only weak scales: unidimensional but not strong in any scaling sense. When H ranges between 0.4 and <0.5 the scales is considered of medium strength and only when H > 0.5, the scale is seen as strong [5]. Higher H values mean that the slope of the ICCs tend to be steeper, which implies that the items discriminate better among different values of θ

Code
aisp(dfm)
      0.3
mhc1    1
mhc2    1
mhc3    1
mhc4    1
mhc5    1
mhc6    1
mhc7    1
mhc8    1
mhc9    1
mhc10   1
mhc11   1
mhc12   1
mhc13   1
mhc14   1
Code
coefH(dfm)
$Hij
      mhc1    se      mhc2    se      mhc3    se      mhc4    se      mhc5   
mhc1                   0.673  (0.014)  0.702  (0.012)  0.477  (0.015)  0.434 
mhc2   0.673  (0.014)                  0.754  (0.012)  0.552  (0.015)  0.477 
mhc3   0.702  (0.012)  0.754  (0.012)                  0.528  (0.015)  0.449 
mhc4   0.477  (0.015)  0.552  (0.015)  0.528  (0.015)                  0.525 
mhc5   0.434  (0.017)  0.477  (0.016)  0.449  (0.016)  0.525  (0.015)        
mhc6   0.477  (0.016)  0.533  (0.015)  0.524  (0.015)  0.549  (0.015)  0.523 
mhc7   0.429  (0.016)  0.472  (0.017)  0.469  (0.016)  0.426  (0.016)  0.426 
mhc8   0.438  (0.016)  0.499  (0.015)  0.505  (0.015)  0.451  (0.016)  0.420 
mhc9   0.547  (0.015)  0.575  (0.015)  0.581  (0.015)  0.514  (0.015)  0.413 
mhc10  0.510  (0.016)  0.549  (0.017)  0.573  (0.015)  0.481  (0.015)  0.368 
mhc11  0.568  (0.015)  0.569  (0.016)  0.562  (0.015)  0.491  (0.016)  0.497 
mhc12  0.556  (0.015)  0.566  (0.015)  0.564  (0.015)  0.567  (0.014)  0.453 
mhc13  0.505  (0.016)  0.535  (0.016)  0.522  (0.016)  0.486  (0.015)  0.401 
mhc14  0.593  (0.015)  0.678  (0.014)  0.683  (0.013)  0.594  (0.014)  0.466 
      se      mhc6    se      mhc7    se      mhc8    se      mhc9    se     
mhc1  (0.017)  0.477  (0.016)  0.429  (0.016)  0.438  (0.016)  0.547  (0.015)
mhc2  (0.016)  0.533  (0.015)  0.472  (0.017)  0.499  (0.015)  0.575  (0.015)
mhc3  (0.016)  0.524  (0.015)  0.469  (0.016)  0.505  (0.015)  0.581  (0.015)
mhc4  (0.015)  0.549  (0.015)  0.426  (0.016)  0.451  (0.016)  0.514  (0.015)
mhc5           0.523  (0.015)  0.426  (0.016)  0.420  (0.016)  0.413  (0.016)
mhc6  (0.015)                  0.641  (0.013)  0.711  (0.011)  0.477  (0.016)
mhc7  (0.016)  0.641  (0.013)                  0.658  (0.013)  0.452  (0.016)
mhc8  (0.016)  0.711  (0.011)  0.658  (0.013)                  0.476  (0.016)
mhc9  (0.016)  0.477  (0.016)  0.452  (0.016)  0.476  (0.016)                
mhc10 (0.017)  0.459  (0.016)  0.411  (0.017)  0.453  (0.015)  0.656  (0.013)
mhc11 (0.016)  0.484  (0.015)  0.470  (0.016)  0.452  (0.016)  0.644  (0.014)
mhc12 (0.016)  0.494  (0.015)  0.424  (0.016)  0.447  (0.016)  0.624  (0.014)
mhc13 (0.017)  0.430  (0.016)  0.394  (0.017)  0.397  (0.017)  0.701  (0.012)
mhc14 (0.016)  0.521  (0.015)  0.442  (0.016)  0.507  (0.015)  0.667  (0.013)
      mhc10   se      mhc11   se      mhc12   se      mhc13   se      mhc14  
mhc1   0.510  (0.016)  0.568  (0.015)  0.556  (0.015)  0.505  (0.016)  0.593 
mhc2   0.549  (0.017)  0.569  (0.016)  0.566  (0.015)  0.535  (0.016)  0.678 
mhc3   0.573  (0.015)  0.562  (0.015)  0.564  (0.015)  0.522  (0.016)  0.683 
mhc4   0.481  (0.015)  0.491  (0.016)  0.567  (0.014)  0.486  (0.015)  0.594 
mhc5   0.368  (0.017)  0.497  (0.016)  0.453  (0.016)  0.401  (0.017)  0.466 
mhc6   0.459  (0.016)  0.484  (0.015)  0.494  (0.015)  0.430  (0.016)  0.521 
mhc7   0.411  (0.017)  0.470  (0.016)  0.424  (0.016)  0.394  (0.017)  0.442 
mhc8   0.453  (0.015)  0.452  (0.016)  0.447  (0.016)  0.397  (0.017)  0.507 
mhc9   0.656  (0.013)  0.644  (0.014)  0.624  (0.014)  0.701  (0.012)  0.667 
mhc10                  0.605  (0.014)  0.582  (0.014)  0.605  (0.014)  0.664 
mhc11  0.605  (0.014)                  0.678  (0.013)  0.613  (0.014)  0.647 
mhc12  0.582  (0.014)  0.678  (0.013)                  0.638  (0.013)  0.691 
mhc13  0.605  (0.014)  0.613  (0.014)  0.638  (0.013)                  0.682 
mhc14  0.664  (0.014)  0.647  (0.014)  0.691  (0.013)  0.682  (0.013)        
      se     
mhc1  (0.015)
mhc2  (0.014)
mhc3  (0.013)
mhc4  (0.014)
mhc5  (0.016)
mhc6  (0.015)
mhc7  (0.016)
mhc8  (0.015)
mhc9  (0.013)
mhc10 (0.014)
mhc11 (0.014)
mhc12 (0.013)
mhc13 (0.013)
mhc14        

$Hi
      Item H  se     
mhc1    0.526 (0.010)
mhc2    0.569 (0.009)
mhc3    0.564 (0.009)
mhc4    0.511 (0.010)
mhc5    0.452 (0.011)
mhc6    0.531 (0.009)
mhc7    0.472 (0.010)
mhc8    0.496 (0.010)
mhc9    0.560 (0.009)
mhc10   0.529 (0.010)
mhc11   0.559 (0.009)
mhc12   0.558 (0.009)
mhc13   0.530 (0.010)
mhc14   0.599 (0.008)

$H
Scale H      se 
  0.530 (0.007) 
Code
mon1 <- check.monotonicity(dfm)
summary(mon1)
      ItemH #ac #vi #vi/#ac maxvi sum sum/#ac zmax #zsig crit
mhc1   0.53 117   0       0     0   0       0    0     0    0
mhc2   0.57 112   0       0     0   0       0    0     0    0
mhc3   0.56 166   0       0     0   0       0    0     0    0
mhc4   0.51 180   0       0     0   0       0    0     0    0
mhc5   0.45 180   0       0     0   0       0    0     0    0
mhc6   0.53 127   0       0     0   0       0    0     0    0
mhc7   0.47 140   0       0     0   0       0    0     0    0
mhc8   0.50 172   0       0     0   0       0    0     0    0
mhc9   0.56 175   0       0     0   0       0    0     0    0
mhc10  0.53 128   0       0     0   0       0    0     0    0
mhc11  0.56 122   0       0     0   0       0    0     0    0
mhc12  0.56 164   0       0     0   0       0    0     0    0
mhc13  0.53 146   0       0     0   0       0    0     0    0
mhc14  0.60 156   0       0     0   0       0    0     0    0
Code
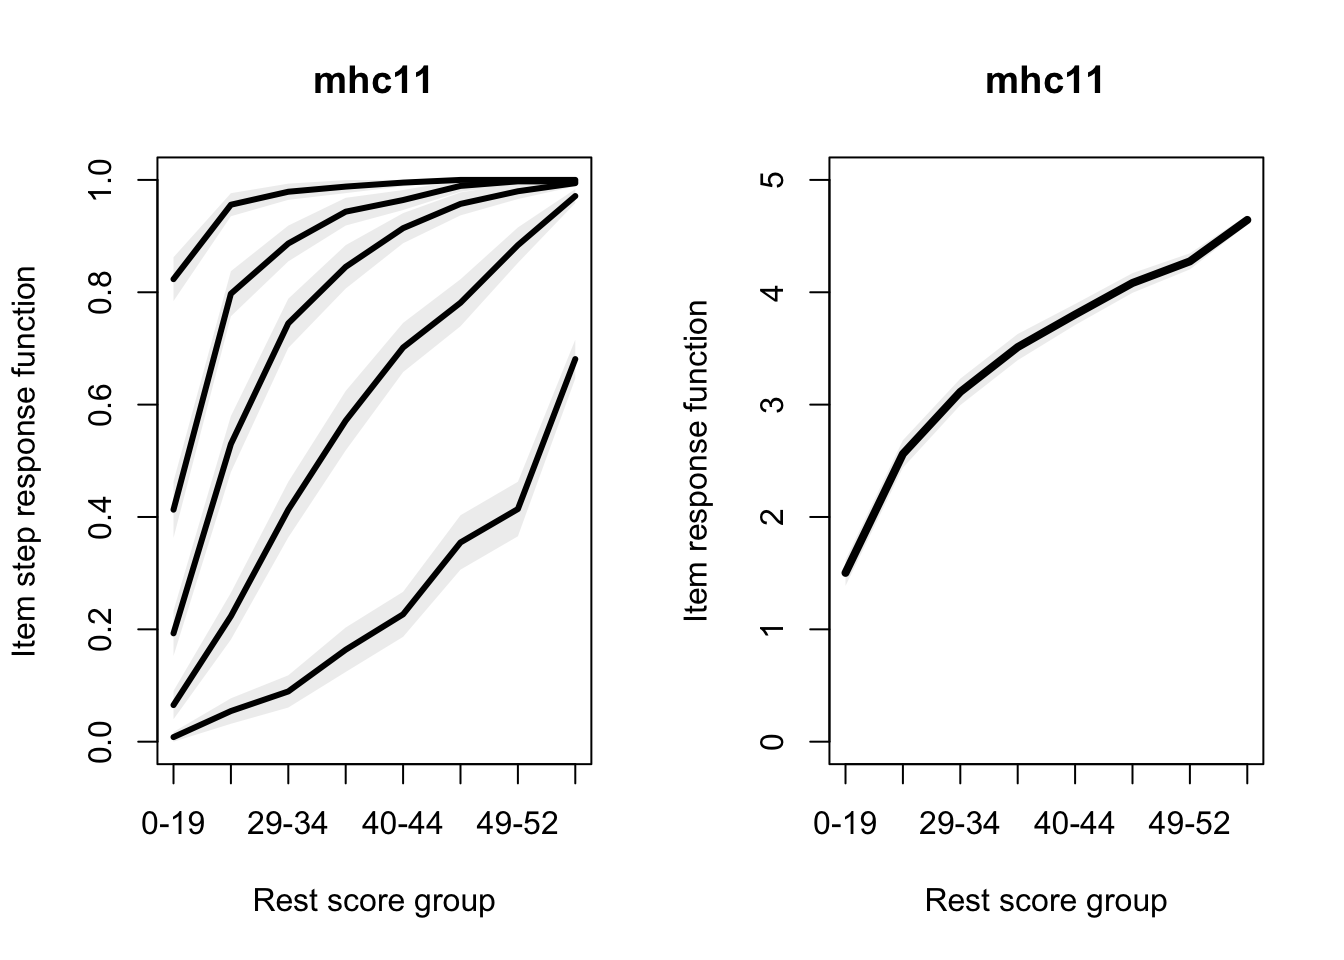
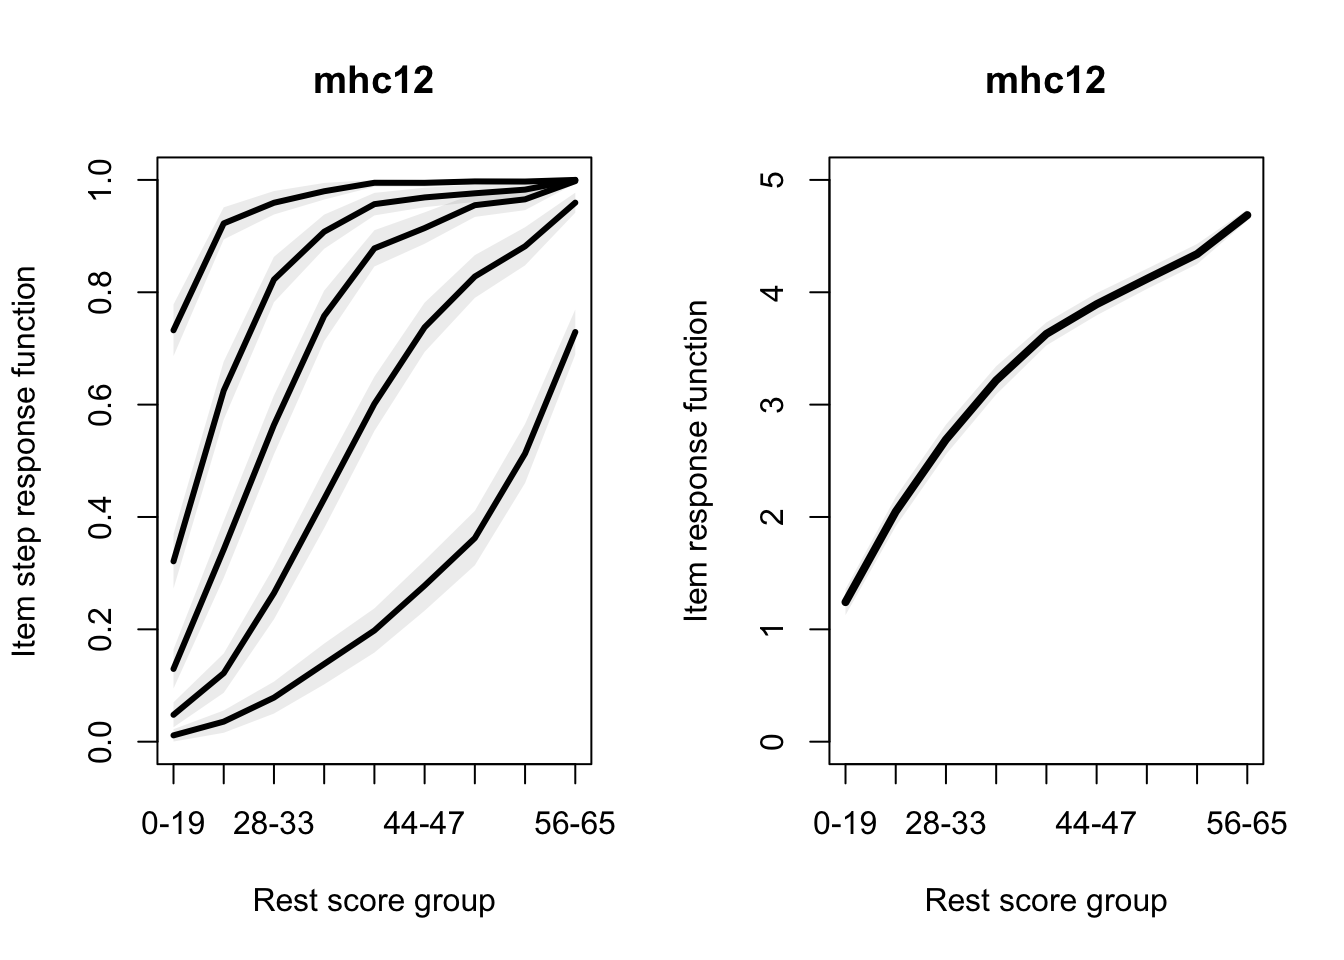
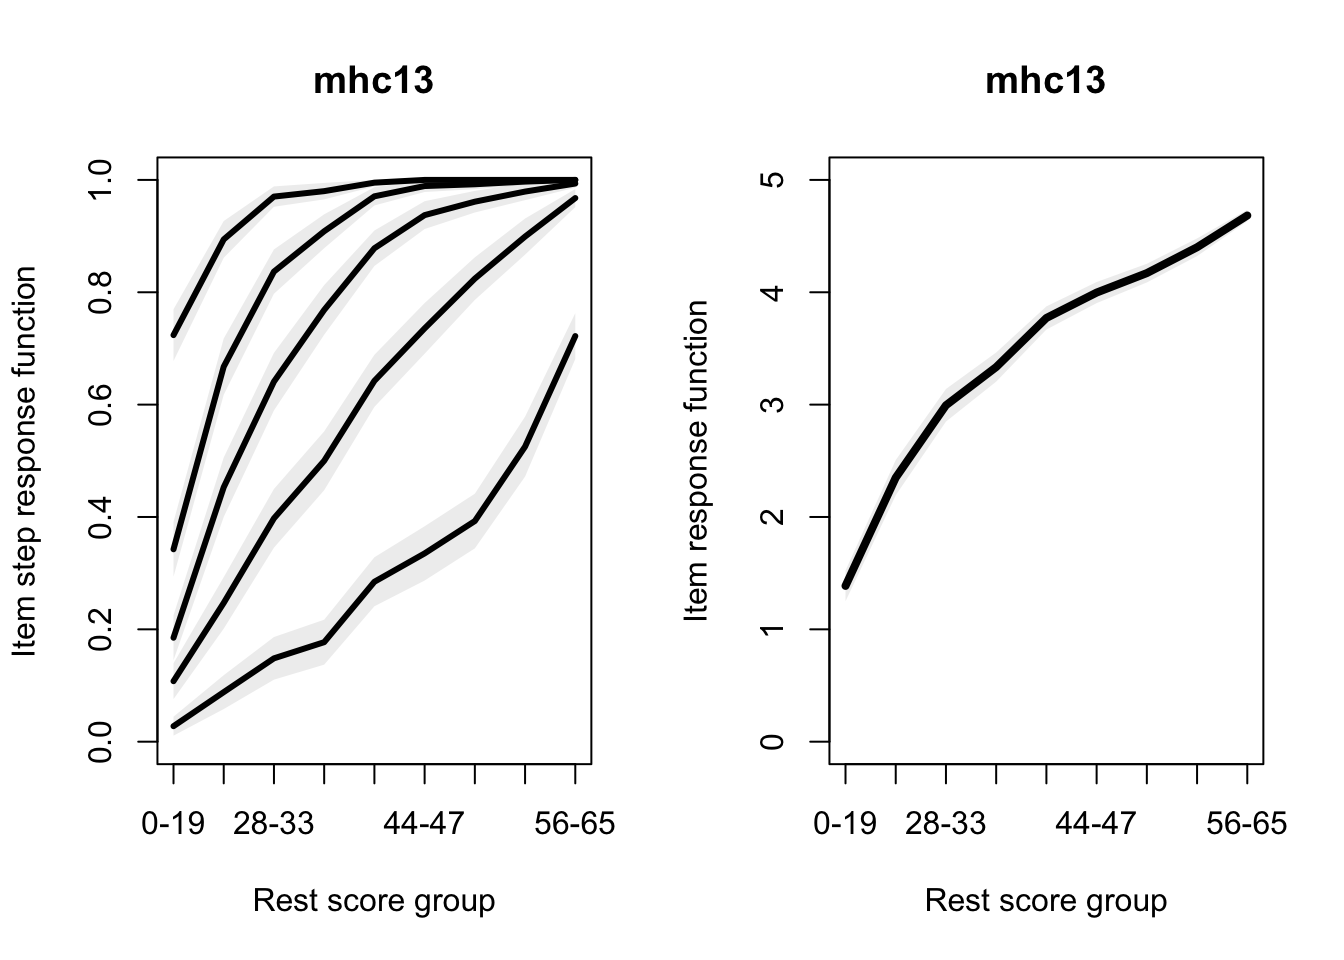
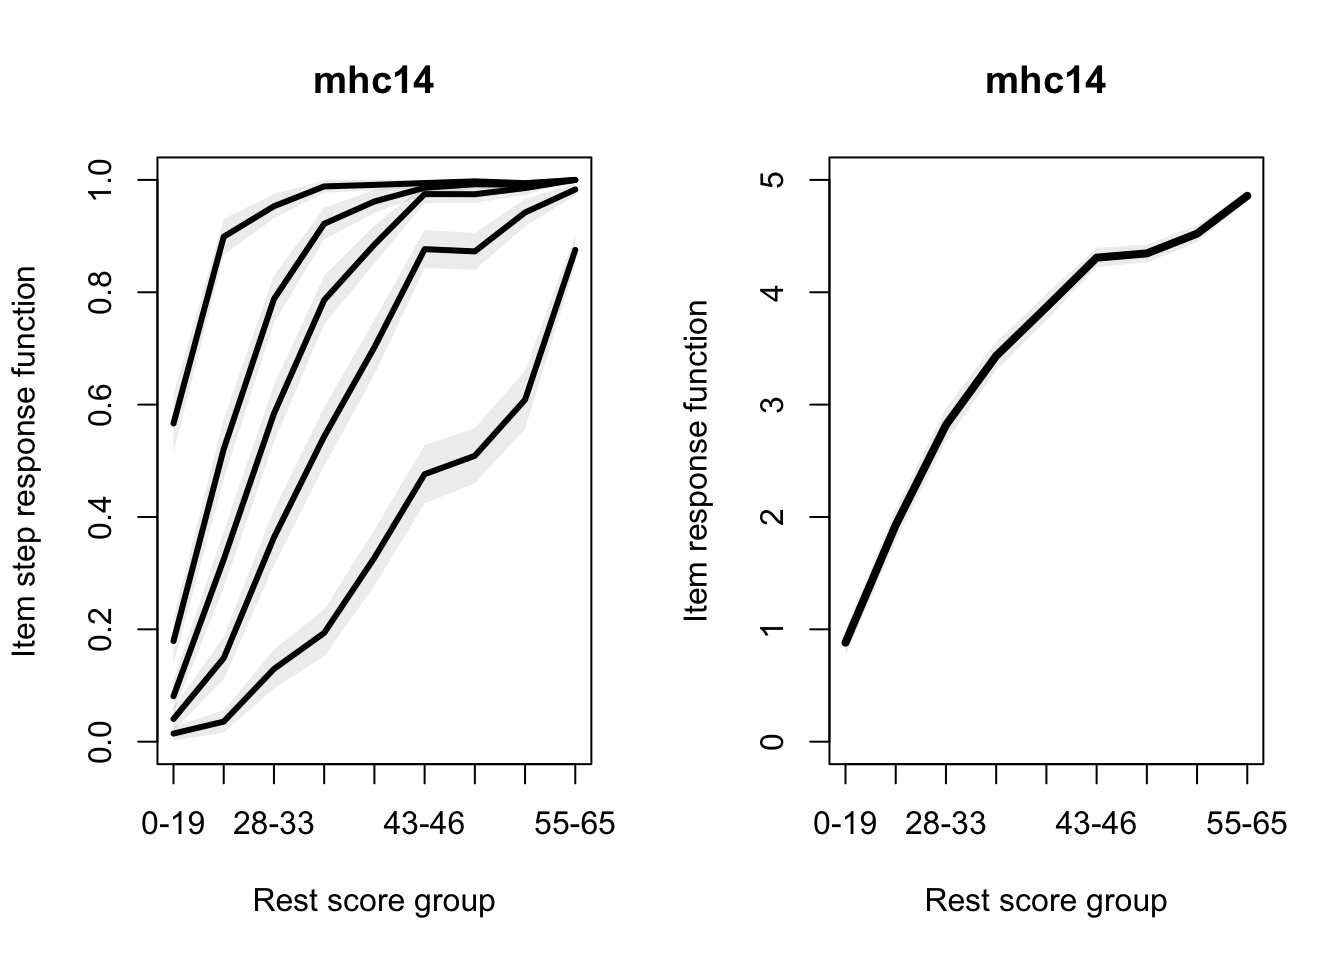
plot(mon1, ask = FALSE)

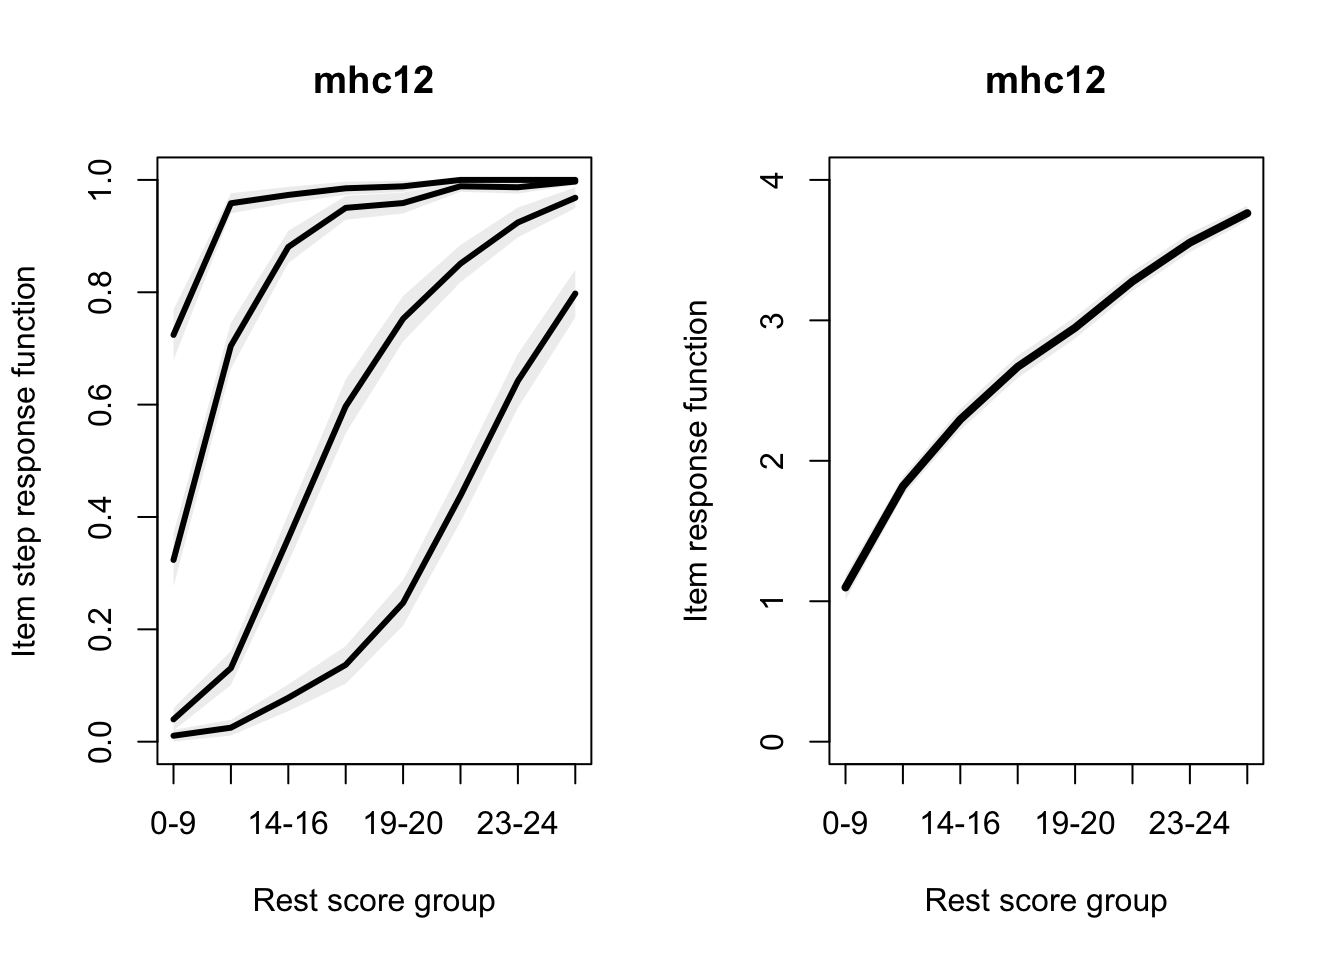
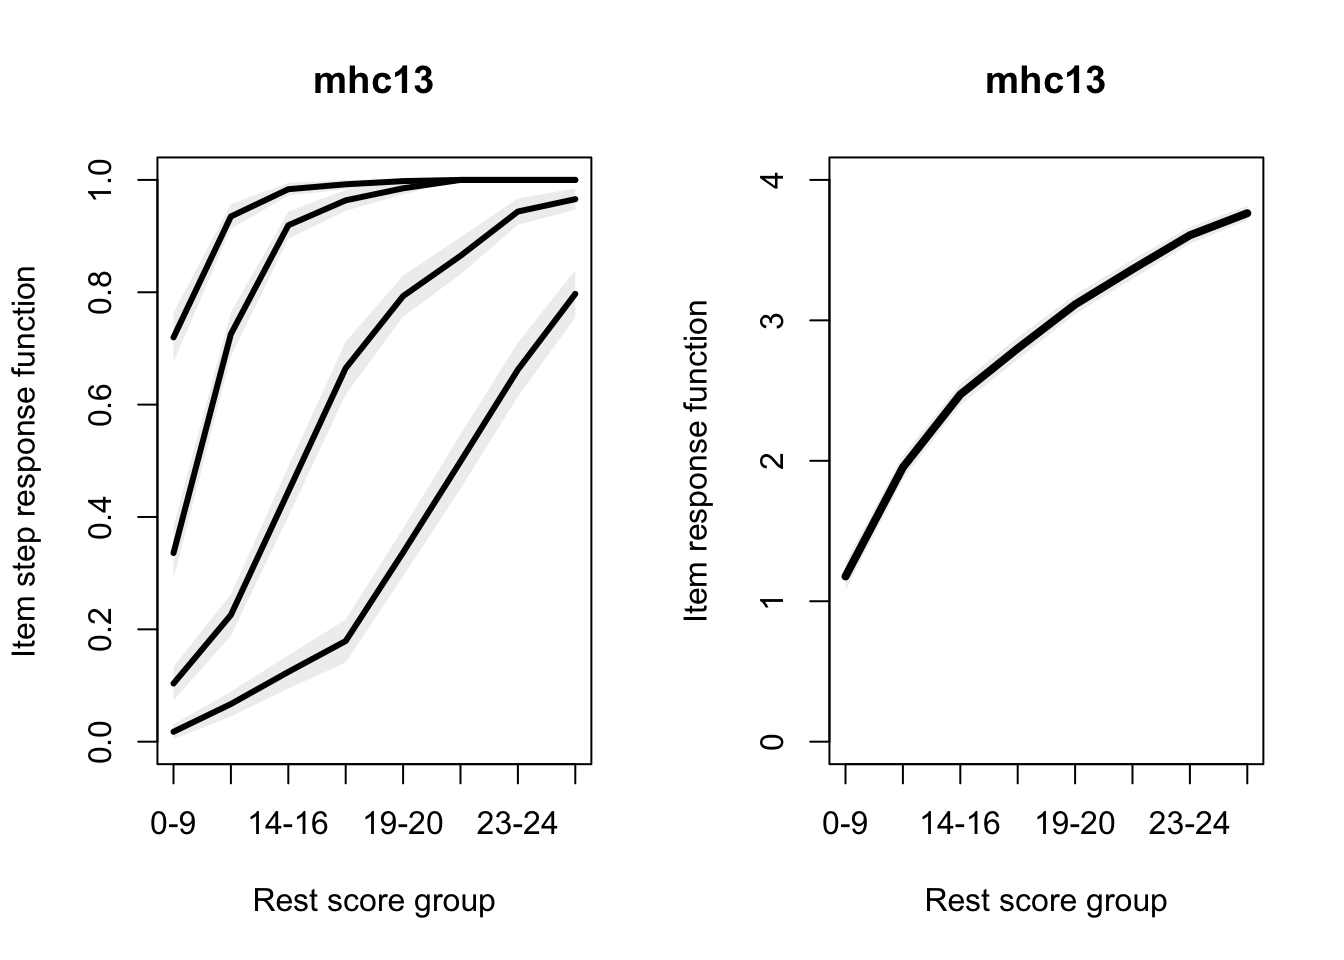
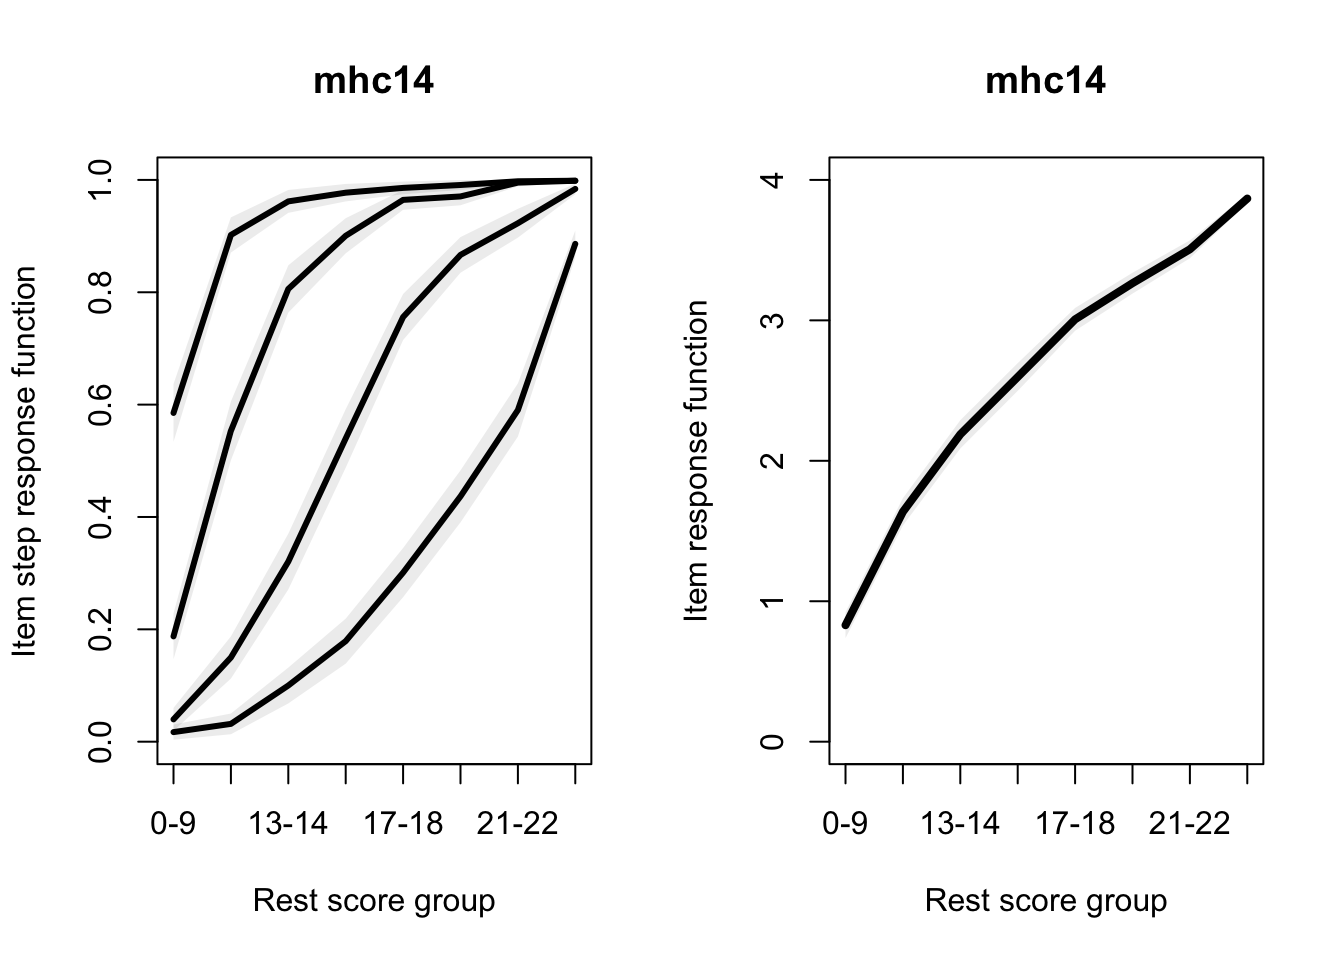
Next we consider the assessment of monotonicity, i.e. that item character- istics curves are monotonically increasing functions of latent trait. Monotonicity is an important feature since it allows the researcher to order respondents on a latent continuum with respect to the sum score of the items belonging to the same scale.

Code
iio1 <- check.iio(dfm)
summary(iio1)
$method
[1] "MIIO"

$item.summary
      ItemH #ac #vi #vi/#ac maxvi  sum sum/#ac  tmax #tsig crit
mhc2   0.57  98   0    0.00  0.00 0.00  0.0000  0.00     0    0
mhc11  0.56  98   4    0.04  0.27 1.00  0.0102  4.79     4   88
mhc14  0.60  95  14    0.15  0.91 5.23  0.0551 12.26    14  286
mhc13  0.53  98   3    0.03  0.50 1.25  0.0127  6.40     3  119
mhc3   0.56  96   4    0.04  0.45 1.32  0.0137  6.40     4  119
mhc10  0.53  98   3    0.03  0.55 1.22  0.0125  7.11     3  127
mhc1   0.53 102  11    0.11  0.91 3.87  0.0380 12.26    11  256
mhc12  0.56  99   5    0.05  0.31 1.24  0.0125  6.20     5  107
mhc9   0.56 100   1    0.01  0.19 0.19  0.0019  2.65     1   38
mhc4   0.51  94   3    0.03  0.35 0.72  0.0077  4.56     2   85
mhc7   0.47 100   4    0.04  0.35 0.89  0.0089  4.56     3   94
mhc5   0.45  97   0    0.00  0.00 0.00  0.0000  0.00     0    0
mhc8   0.50 100   0    0.00  0.00 0.00  0.0000  0.00     0    0
mhc6   0.53 101   0    0.00  0.00 0.00  0.0000  0.00     0    0

$backward.selection
      step 1 step 2 step 3 step 4
mhc2       0      0      0      0
mhc11      2      1      0      0
mhc14      8     NA     NA     NA
mhc13      2      1      0      0
mhc3       2      1      0      0
mhc10      2      1      0      0
mhc1       6      5     NA     NA
mhc12      2      1      0      0
mhc9       1      0      0      0
mhc4       1      1      1      0
mhc7       2      1      1     NA
mhc5       0      0      0      0
mhc8       0      0      0      0
mhc6       0      0      0      0

$HT
[1] 0.3866919

Checking of IIO within the R “mokken” library is done using the function check.iio. Three different method options are available to users – (1) manifest invariant item ordering (MIIO), (2) manifest scale - cumulative probabil- ity mode (MSCPM) and (3) increasingness in transpos- ition (IT).

The backward selection method can be used to re- move items violating IIO. If there is an equal number of violations for two or more items then the item with the lowest scalability is removed [14]. As an alternative to this exploratory approach, the worst item found to be violating the IIO property can be discarded and IIO of the rest of the items checked again, in iterative steps. Likewise for monotonicity, it is recommended to only remove one item at a time since IIO violations of other items may be influenced by the inclusion or exclusion of any particular item.

Code
pmatr1 <- check.pmatrix(dfm)
summary(pmatr1)
      ItemH   #ac #vi #vi/#ac maxvi  sum sum/#ac  zmax #zsig crit
mhc1   0.53 19500  20    0.00  0.06 0.83   0e+00  8.61    20   95
mhc2   0.57 19500  55    0.00  0.08 2.35   1e-04 11.29    55  148
mhc3   0.56 19500  60    0.00  0.06 2.34   1e-04 12.16    60  154
mhc4   0.51 19500  33    0.00  0.05 1.17   1e-04  8.95    33  113
mhc5   0.45 19500 214    0.01  0.08 9.03   5e-04 12.31   214  255
mhc6   0.53 19500 142    0.01  0.07 5.75   3e-04 11.15   142  207
mhc7   0.47 19500  83    0.00  0.06 3.22   2e-04  9.49    83  163
mhc8   0.50 19500 195    0.01  0.06 7.88   4e-04 11.39   195  237
mhc9   0.56 19500  92    0.00  0.07 3.86   2e-04 12.31    92  182
mhc10  0.53 19500  66    0.00  0.06 2.64   1e-04 11.39    66  157
mhc11  0.56 19500  43    0.00  0.06 1.72   1e-04  9.26    43  124
mhc12  0.56 19500  95    0.00  0.06 3.79   2e-04 10.32    95  172
mhc13  0.53 19500  73    0.00  0.06 2.96   2e-04 10.93    73  161
mhc14  0.60 19500 109    0.01  0.07 4.39   2e-04 11.32   109  185
Code
#plot(pmatr1)
Code
restsc1 <- check.restscore(dfm)
summary(restsc1)
      ItemH  #ac #vi #vi/#ac maxvi  sum sum/#ac zmax #zsig crit
mhc1   0.53 2550  20    0.01  0.10 1.07  0.0004 3.37    14   68
mhc2   0.57 2450  22    0.01  0.21 1.88  0.0008 6.52    17  102
mhc3   0.56 2400  35    0.01  0.17 2.21  0.0009 5.59    23  103
mhc4   0.51 2350  43    0.02  0.15 2.42  0.0010 4.13    24   99
mhc5   0.45 2425  95    0.04  0.25 7.84  0.0032 8.01    76  192
mhc6   0.53 2525  43    0.02  0.19 3.19  0.0013 6.56    27  121
mhc7   0.47 2500  58    0.02  0.16 3.60  0.0014 5.79    45  135
mhc8   0.50 2500  63    0.03  0.25 4.25  0.0017 6.88    54  157
mhc9   0.56 2500  25    0.01  0.24 2.23  0.0009 7.57    17  112
mhc10  0.53 2450  30    0.01  0.13 1.69  0.0007 4.33    21   90
mhc11  0.56 2450  22    0.01  0.25 1.57  0.0006 6.88    13  101
mhc12  0.56 2475  37    0.01  0.23 2.73  0.0011 6.23    29  121
mhc13  0.53 2450  29    0.01  0.15 1.79  0.0007 4.42    21   92
mhc14  0.60 2375  64    0.03  0.25 4.89  0.0021 8.01    55  161
Code
#plot(restsc1)

the number of significant violations (#zsig).

4.2 Mokken 2

Based on Rasch results, we remove som items and recode response categories.

Code
removed.items <- c("mhc3","mhc8","mhc5","mhc6","mhc7","mhc2")

dfm <- df %>% 
  select(!any_of(removed.items)) %>% 
  mutate(across(everything(), ~ car::recode(.x,"3=2;4=3;5=4"))) %>% 
  mutate(mhc4 = car::recode(mhc4,"1=0;2=1;3=2;4=3")) %>% 
  as.matrix()
Code
mon2 <- check.monotonicity(dfm)
summary(mon2)
      ItemH #ac #vi #vi/#ac maxvi sum sum/#ac zmax #zsig crit
mhc1   0.53 105   0       0     0   0       0    0     0    0
mhc4   0.53  84   0       0     0   0       0    0     0    0
mhc9   0.61 105   0       0     0   0       0    0     0    0
mhc10  0.58 101   0       0     0   0       0    0     0    0
mhc11  0.60 105   0       0     0   0       0    0     0    0
mhc12  0.61  94   0       0     0   0       0    0     0    0
mhc13  0.60  76   0       0     0   0       0    0     0    0
mhc14  0.65 112   0       0     0   0       0    0     0    0
Code
plot(mon2, ask = FALSE)

Code
iio2 <- check.iio(dfm)
summary(iio2)
$method
[1] "MIIO"

$item.summary
      ItemH #ac #vi #vi/#ac maxvi  sum sum/#ac  tmax #tsig crit
mhc14  0.65  43   9    0.21  0.81 3.04  0.0708 14.26     9  297
mhc11  0.60  47   3    0.06  0.48 0.99  0.0211  8.76     3  139
mhc13  0.60  46   3    0.07  0.47 0.95  0.0206  7.69     3  132
mhc10  0.58  46   3    0.07  0.39 0.94  0.0204  6.82     3  121
mhc12  0.61  46   4    0.09  0.53 1.21  0.0262  9.75     4  162
mhc1   0.53  49  10    0.20  0.81 3.54  0.0723 14.26    10  307
mhc9   0.61  44   2    0.05  0.16 0.29  0.0065  4.47     2   59
mhc4   0.53  43   0    0.00  0.00 0.00  0.0000  0.00     0    0

$backward.selection
      step 1 step 2 step 3
mhc14      6      5     NA
mhc11      2      1      0
mhc13      2      1      0
mhc10      2      1      0
mhc12      2      1      0
mhc1       6     NA     NA
mhc9       2      1      0
mhc4       0      0      0

$HT
[1] 0.5405988
Code
pmatr2 <- check.pmatrix(dfm)
summary(pmatr2)
      ItemH  #ac #vi #vi/#ac maxvi sum sum/#ac zmax #zsig crit
mhc1   0.53 2688   0       0     0   0       0    0     0    0
mhc4   0.53 2688   0       0     0   0       0    0     0    0
mhc9   0.61 2688   0       0     0   0       0    0     0    0
mhc10  0.58 2688   0       0     0   0       0    0     0    0
mhc11  0.60 2688   0       0     0   0       0    0     0    0
mhc12  0.61 2688   0       0     0   0       0    0     0    0
mhc13  0.60 2688   0       0     0   0       0    0     0    0
mhc14  0.65 2688   0       0     0   0       0    0     0    0
Code
#plot(pmatr2)
Code
restsc2 <- check.restscore(dfm)
summary(restsc2)
      ItemH #ac #vi #vi/#ac maxvi  sum sum/#ac zmax #zsig crit
mhc1   0.53 784  10    0.01  0.10 0.51   6e-04 3.11     7   53
mhc4   0.53 688   6    0.01  0.10 0.33   5e-04 5.30     5   57
mhc9   0.61 704   2    0.00  0.04 0.08   1e-04 2.35     2   19
mhc10  0.58 736   4    0.01  0.07 0.19   3e-04 3.68     1   28
mhc11  0.60 752   2    0.00  0.04 0.08   1e-04 3.05     2   23
mhc12  0.61 736   4    0.01  0.10 0.26   4e-04 3.11     4   38
mhc13  0.60 736   2    0.00  0.07 0.10   1e-04 3.83     1   25
mhc14  0.65 688  12    0.02  0.10 0.62   9e-04 5.30     8   62
Code
#plot(restsc2)

4.3 Software used

Code
pkgs <- cite_packages(cite.tidyverse = TRUE, 
                      output = "table",
                      bib.file = "grateful-refs.bib",
                      include.RStudio = TRUE,
                      out.dir = getwd())
formattable(pkgs, 
            table.attr = 'class=\"table table-striped\" style="font-size: 15px; font-family: Lato; width: 80%"')
Package Version Citation
base 4.3.2 R Core Team (2023)
car 3.1.2 Fox and Weisberg (2019)
cowplot 1.1.2 Wilke (2023)
eRm 1.0.4 Mair and Hatzinger (2007b); Mair and Hatzinger (2007a); Hatzinger and Rusch (2009); Rusch, Maier, and Hatzinger (2013); Koller, Maier, and Hatzinger (2015); Debelak and Koller (2019)
formattable 0.2.1 Ren and Russell (2021)
ggrepel 0.9.5 Slowikowski (2024)
glue 1.7.0 Hester and Bryan (2024)
kableExtra 1.3.4 Zhu (2021)
knitr 1.45 Xie (2014); Xie (2015); Xie (2023)
lavaan 0.6.17 Rosseel (2012)
lavaanExtra 0.2.0 Thériault (2023)
lavaanPlot 0.6.2 Lishinski (2021)
matrixStats 1.2.0 Bengtsson (2023)
mirt 1.41 Chalmers (2012)
mokken 3.1.0 Van der Ark (2007); Van der Ark (2012)
patchwork 1.2.0 Pedersen (2024)
psych 2.3.12 William Revelle (2023)
psychotree 0.16.0 Trepte and Verbeet (2010); Strobl, Wickelmaier, and Zeileis (2011); Strobl, Kopf, and Zeileis (2015); Komboz, Zeileis, and Strobl (2018); Wickelmaier and Zeileis (2018)
reshape 0.8.9 Wickham (2007)
RISEkbmRasch 0.1.31.0 Johansson (2024)
rmarkdown 2.25 Xie, Allaire, and Grolemund (2018); Xie, Dervieux, and Riederer (2020); Allaire et al. (2023)
tidyverse 2.0.0 Wickham et al. (2019)

4.4 References

Allaire, JJ, Yihui Xie, Christophe Dervieux, Jonathan McPherson, Javier Luraschi, Kevin Ushey, Aron Atkins, et al. 2023. rmarkdown: Dynamic Documents for r. https://github.com/rstudio/rmarkdown.
Bengtsson, Henrik. 2023. matrixStats: Functions That Apply to Rows and Columns of Matrices (and to Vectors). https://CRAN.R-project.org/package=matrixStats.
Chalmers, R. Philip. 2012. mirt: A Multidimensional Item Response Theory Package for the R Environment.” Journal of Statistical Software 48 (6): 1–29. https://doi.org/10.18637/jss.v048.i06.
Debelak, Rudolf, and Ingrid Koller. 2019. “Testing the Local Independence Assumption of the Rasch Model with Q3-Based Nonparametric Model Tests.” Applied Psychological Measurement 44. https://doi.org/10.1177/0146621619835501.
Fox, John, and Sanford Weisberg. 2019. An R Companion to Applied Regression. Third. Thousand Oaks CA: Sage. https://socialsciences.mcmaster.ca/jfox/Books/Companion/.
Hatzinger, Reinhold, and Thomas Rusch. 2009. “IRT Models with Relaxed Assumptions in eRm: A Manual-Like Instruction.” Psychology Science Quarterly 51.
Hester, Jim, and Jennifer Bryan. 2024. glue: Interpreted String Literals. https://CRAN.R-project.org/package=glue.
Johansson, Magnus. 2024. RISEkbmRasch: Psychometric Analysis in r with Rasch Measurement Theory. https://github.com/pgmj/RISEkbmRasch.
Koller, Ingrid, Marco Maier, and Reinhold Hatzinger. 2015. “An Empirical Power Analysis of Quasi-Exact Tests for the Rasch Model: Measurement Invariance in Small Samples.” Methodology 11. https://doi.org/10.1027/1614-2241/a000090.
Komboz, Basil, Achim Zeileis, and Carolin Strobl. 2018. “Tree-Based Global Model Tests for Polytomous Rasch Models.” Educational and Psychological Measurement 78 (1): 128–66. https://doi.org/10.1177/0013164416664394.
Lishinski, Alex. 2021. lavaanPlot: Path Diagrams for Lavaan Models via DiagrammeR. https://CRAN.R-project.org/package=lavaanPlot.
Mair, Patrick, and Reinhold Hatzinger. 2007a. “CML Based Estimation of Extended Rasch Models with the eRm Package in r.” Psychology Science 49. https://doi.org/10.18637/jss.v020.i09.
———. 2007b. “Extended Rasch Modeling: The eRm Package for the Application of IRT Models in r.” Journal of Statistical Software 20. https://doi.org/10.18637/jss.v020.i09.
Pedersen, Thomas Lin. 2024. patchwork: The Composer of Plots. https://CRAN.R-project.org/package=patchwork.
R Core Team. 2023. R: A Language and Environment for Statistical Computing. Vienna, Austria: R Foundation for Statistical Computing. https://www.R-project.org/.
Ren, Kun, and Kenton Russell. 2021. formattable: Create Formattable Data Structures. https://CRAN.R-project.org/package=formattable.
Rosseel, Yves. 2012. lavaan: An R Package for Structural Equation Modeling.” Journal of Statistical Software 48 (2): 1–36. https://doi.org/10.18637/jss.v048.i02.
Rusch, Thomas, Marco Maier, and Reinhold Hatzinger. 2013. “Linear Logistic Models with Relaxed Assumptions in r.” In Algorithms from and for Nature and Life, edited by Berthold Lausen, Dirk van den Poel, and Alfred Ultsch. Studies in Classification, Data Analysis, and Knowledge Organization. New York: Springer. https://doi.org/10.1007/978-3-319-00035-0_34.
Sijtsma, Klaas, and L. Andries van der Ark. 2017. “A tutorial on how to do a Mokken scale analysis on your test and questionnaire data.” The British Journal of Mathematical and Statistical Psychology 70 (1): 137–58. https://doi.org/10.1111/bmsp.12078.
Slowikowski, Kamil. 2024. ggrepel: Automatically Position Non-Overlapping Text Labels with ggplot2. https://CRAN.R-project.org/package=ggrepel.
Stochl, Jan, Peter B. Jones, and Tim J. Croudace. 2012. “Mokken Scale Analysis of Mental Health and Well-Being Questionnaire Item Responses: A Non-Parametric IRT Method in Empirical Research for Applied Health Researchers.” BMC Medical Research Methodology 12 (1): 74. https://doi.org/10.1186/1471-2288-12-74.
Strobl, Carolin, Julia Kopf, and Achim Zeileis. 2015. “Rasch Trees: A New Method for Detecting Differential Item Functioning in the Rasch Model.” Psychometrika 80 (2): 289–316. https://doi.org/10.1007/s11336-013-9388-3.
Strobl, Carolin, Florian Wickelmaier, and Achim Zeileis. 2011. “Accounting for Individual Differences in Bradley-Terry Models by Means of Recursive Partitioning.” Journal of Educational and Behavioral Statistics 36 (2): 135–53. https://doi.org/10.3102/1076998609359791.
Thériault, Rémi. 2023. lavaanExtra: Convenience Functions for Lavaan.” Journal of Open Source Software 8 (90): 5701. https://doi.org/10.21105/joss.05701.
Trepte, Sabine, and Markus Verbeet, eds. 2010. Allgemeinbildung in Deutschland – Erkenntnisse Aus Dem SPIEGEL Studentenpisa-Test. Wiesbaden: VS Verlag.
Van der Ark, L. Andries. 2007. “Mokken Scale Analysis in R.” Journal of Statistical Software 20 (11): 1–19. https://doi.org/10.18637/jss.v020.i11.
———. 2012. “New Developments in Mokken Scale Analysis in R.” Journal of Statistical Software 48 (5): 1–27. https://doi.org/10.18637/jss.v048.i05.
Wickelmaier, Florian, and Achim Zeileis. 2018. “Using Recursive Partitioning to Account for Parameter Heterogeneity in Multinomial Processing Tree Models.” Behavior Research Methods 50 (3): 1217–33. https://doi.org/10.3758/s13428-017-0937-z.
Wickham, Hadley. 2007. “Reshaping Data with the Reshape Package.” Journal of Statistical Software 21 (12). https://www.jstatsoft.org/v21/i12/.
Wickham, Hadley, Mara Averick, Jennifer Bryan, Winston Chang, Lucy D’Agostino McGowan, Romain François, Garrett Grolemund, et al. 2019. “Welcome to the tidyverse.” Journal of Open Source Software 4 (43): 1686. https://doi.org/10.21105/joss.01686.
Wilke, Claus O. 2023. cowplot: Streamlined Plot Theme and Plot Annotations for ggplot2. https://CRAN.R-project.org/package=cowplot.
William Revelle. 2023. psych: Procedures for Psychological, Psychometric, and Personality Research. Evanston, Illinois: Northwestern University. https://CRAN.R-project.org/package=psych.
Xie, Yihui. 2014. knitr: A Comprehensive Tool for Reproducible Research in R.” In Implementing Reproducible Computational Research, edited by Victoria Stodden, Friedrich Leisch, and Roger D. Peng. Chapman; Hall/CRC.
———. 2015. Dynamic Documents with R and Knitr. 2nd ed. Boca Raton, Florida: Chapman; Hall/CRC. https://yihui.org/knitr/.
———. 2023. knitr: A General-Purpose Package for Dynamic Report Generation in r. https://yihui.org/knitr/.
Xie, Yihui, J. J. Allaire, and Garrett Grolemund. 2018. R Markdown: The Definitive Guide. Boca Raton, Florida: Chapman; Hall/CRC. https://bookdown.org/yihui/rmarkdown.
Xie, Yihui, Christophe Dervieux, and Emily Riederer. 2020. R Markdown Cookbook. Boca Raton, Florida: Chapman; Hall/CRC. https://bookdown.org/yihui/rmarkdown-cookbook.
Zhu, Hao. 2021. kableExtra: Construct Complex Table with kable and Pipe Syntax. https://CRAN.R-project.org/package=kableExtra.